Project
k6-loadtest-mcp: An AI-Driven Load Testing MCP Server
Describe an API in plain English, get a k6 load test generated, run, and summarized — an MCP server for Claude.
Key highlights
- 🧠 Plain-English API description → structured TestPlan → runnable k6 script
- 🔒 Human-gated host allowlist — an agent-authored plan cannot add its own approved target
- 📊 Deterministic metrics parsing — numbers are computed, never LLM-guessed
- 🧱 Guardrailed by design: VUs capped at 1000, generated requests do not follow redirects
- 📈 Optional dashboard — `publish_report` turns a run into a shareable URL with automatic regression comparison against the previous run of the same test
Overview#
k6-loadtest-mcp is a Model Context Protocol ↗ server that lets you describe an API in plain English — or just paste a few example curl commands — and get a real, runnable k6 ↗ load test out the other end: generated, smoke-tested, executed, and summarized with deterministic, structured metrics.
It’s built for Claude Desktop and Claude Code. The “understanding what to test” step is left to whichever Claude client is driving the conversation — no separate API key needed — while the MCP server itself does the mechanical, deterministic parts in plain code: script generation, execution, and result parsing. That split is the whole point of the project.
Why I Built This#
Load testing tools are good at running load; they’re bad at being described to. You either hand-write a k6/JMeter/Locust script, or you fight a GUI. Meanwhile, LLM coding assistants are very good at turning a description into a plan — but if you let one just read k6’s console output and summarize it, you’ve handed the “is this number real” question to something that hallucinates.
So the design constraint I set for myself was:
The LLM plans. Code executes and parses. The two never trade places.
Concretely: the host LLM (Claude) turns a description into a structured TestPlan (Zod-validated). Everything after that — templating the k6 script, running it, parsing k6’s summary JSON into RunMetrics — is deterministic TypeScript with zero LLM involvement. The report you get back is built from numbers a parser computed, not numbers a model guessed while skimming a terminal log.
Pipeline#
you describe the API / paste example requests
        │  (host LLM turns this into a structured TestPlan)
        ▼
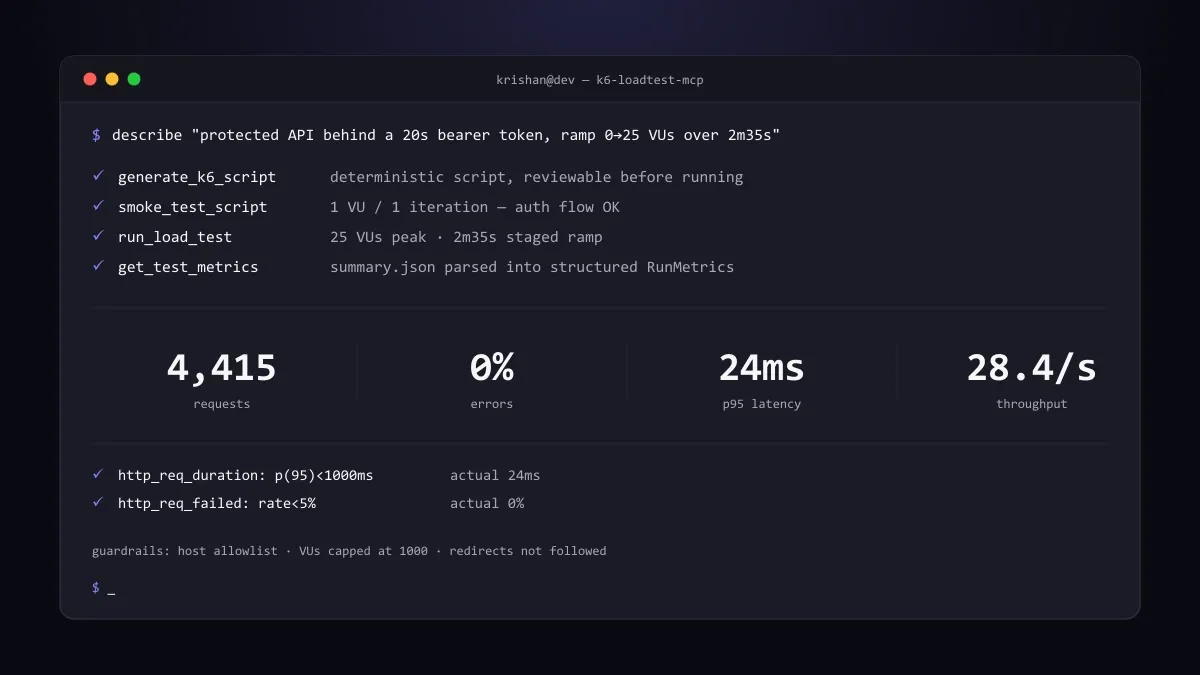
generate_k6_script   → deterministic templating, reviewable script.js
        ▼
smoke_test_script    → 1 VU / 1 iteration, catches syntax/runtime errors fast
        ▼
run_load_test        → full run at the VUs/duration/stages baked into the script
        ▼
get_test_metrics     → k6's summary.json parsed into structured RunMetrics
        ▼
host LLM writes the narrative report from those structured metrics
        ▼
publish_report (optional) → shareable dashboard URL, see belowrun_full_test chains all four steps for convenience; the granular tools let you inspect or hand-edit the generated script between steps — which matters more than it sounds, below.
The Guardrail: Agents Don’t Get to Expand Their Own Blast Radius#
The part of this project I’m most glad I got right on the first pass: load tests only run against hosts on an explicit allowlist, and the tools themselves cannot add to it.
// guardrails.ts
export function assertTargetAllowed(baseUrl: string): void {
  const { allowedHosts } = loadConfig(); // read-only from the tools' point of view
  const hostname = new URL(baseUrl).hostname.toLowerCase();

  const ok = allowedHosts.some((entry) => /* exact or *.suffix match */);
  if (!ok) {
    throw new Error(
      `Target host "${hostname}" is not in the allowlist. ` +
      `Hitting a host you don't control can look like a denial-of-service attack. ` +
      `Add it yourself, by hand, once you've confirmed you're authorized.`
    );
  }
}An LLM-authored plan — whether from a genuine request or a prompt-injected one — can ask for anything, but it can’t get load thrown at a new host without a human manually editing a config file first. I hit this guardrail myself, live, while first testing the tool against my own domain: it refused, explained why, and I had to explicitly confirm and edit the file before the run would go ahead. That’s exactly the friction it’s supposed to create.
Two more guardrails followed the same rule after a deeper self-review of the project:
MAX_VUS = 1000, enforced in the Zod schema on bothloadProfile.vusand every stage’starget— hardcoded in source, not a config value a plan can raise.- Generated requests set
redirects: 0. The allowlist only vets the request’s starting host; without this, a 3xx response could silently redirect load at a host that was never approved.
Dashboard: A Report That Outlives the Chat#
By default, a report is whatever the host LLM types into the chat — useful in the moment, gone once the
conversation scrolls. dashboard/ is an optional Spring Boot + Thymeleaf app, deployed separately from the
MCP server, that a run’s structured metrics can be published to via a publish_report tool call, turning
the report into a real, shareable URL. Every run is also compared against the previous run of the same test
name, so latency/error-rate/RPS regressions surface automatically — no separate baseline step to set up.
It’s entirely opt-in: everything else works with zero dashboard configured, and run_full_test’s response
just flags dashboardConfigured so the host LLM knows to ask before publishing rather than doing it
silently — a run’s data becomes visible on whatever that dashboard instance’s own access posture is (private,
Basic-Auth-gated by default; a narrower “public demo” posture trades the login for a target pinned to one
host, so an open ingest endpoint can’t become an anonymous load-testing egress point).
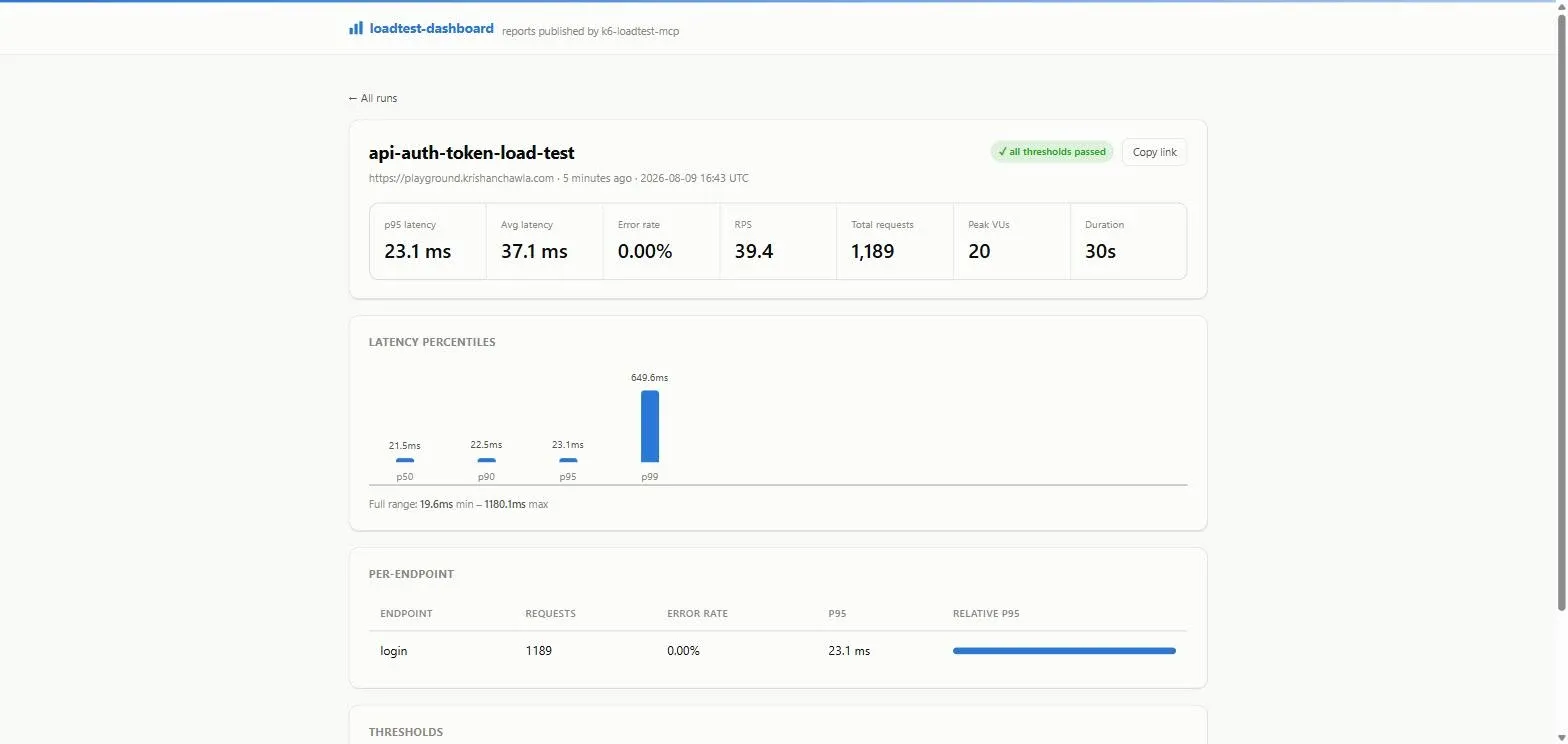
That screenshot isn’t staged — it’s the actual dashboard page for a run I did live: ramping POST /api/scenarios/api-auth/token to 20 concurrent users over 20 seconds against my own practice API sandbox.
1,189 requests, 0% errors, p95 23.1ms, both thresholds green. There’s a live public instance at
projects.krishanchawla.com/ai/loadtest-dashboard ↗ —
open to read without a login, and pinned to that same sandbox host if you want to point your own
k6-loadtest-mcp at it and publish a run of your own.
Solving a Real Auth Problem Live#
The first real target I pointed this at was an API sitting behind a login flow — POST /token issuing a bearer token with a 20-second expiry. The tool’s flat, weighted-request-mix design has no way to thread a value from one response into a later request’s headers, so a naive script would 401 almost immediately.
The fix used exactly the tool’s own intended workflow: generate a baseline script, then hand-edit it before running. I added a per-VU token cache — k6’s module-level state persists across iterations within a VU — that logs in once, reuses the token until ~3 seconds before it expires, then transparently refreshes:
let cachedToken = null;
let tokenExpiresAtMs = 0;

function getToken() {
  if (!cachedToken || Date.now() >= tokenExpiresAtMs - 3000) login();
  return cachedToken;
}The resulting run — 25 concurrent VUs over 2m35s — logged in roughly once every 30 requests (exactly what a 20s token TTL against a ~650ms iteration time predicts) and never once sent a request with a stale token: 4,415 requests, 0% errors, p95 24ms.
What I Learned#
- Where an LLM should stop being trusted is a design decision, not an afterthought — drawing that line up front (plan vs. execute) shaped almost every other choice in the codebase.
- A guardrail that the agent can bypass isn’t a guardrail — the allowlist file, the VUs cap, and the redirect fix are all deliberately code, not agent-writable state, for the same reason.
- Deterministic parsing beats an LLM eyeballing a log — but it means reading k6’s actual summary JSON output very carefully. A
passescount on a “failed” Rate metric means the failure count, not the success count; athresholdsboolean means “was this breached,” the opposite of “passed.” Both are the kind of gotcha you only catch by cross-checking against the CLI’s own✓/✗output, not by trusting the docs. - The generated script is the actual interface, not the chat conversation — designing it to be reviewable and hand-editable turned out to matter more than making the initial generation smarter.
What’s Not Here Yet#
- Auth token chaining —
TestPlanmodels a weighted mix of independent requests; there’s no declarative way to fetch a token in one request and reuse it in a later one. That’s exactly why “Solving a Real Auth Problem Live” above needed a hand-edited script rather than aTestPlanfeature — found concretely while picking a target for the public demo, sinceplayground.krishanchawla.com’s auth-flow sandbox needs exactly this and can’t be fully exercised throughTestPlanalone yet. - Standalone CLI mode — same pipeline, driven by a script with its own
ANTHROPIC_API_KEYinstead of an MCP host, for CI use. The core (script templating, summary parsing) is already host-agnostic; this would add a thin agent loop on top. - CI-gate baseline diffing — the dashboard already diffs each run against the previous run of the same
test
namefor human viewing; failing a CI job on regression would need that comparison surfaced as a pass/fail exit code. - OpenAPI/Postman ingestion — deriving the request mix automatically from a spec instead of the host LLM inferring it from a description.
- JMeter export — k6 is the primary engine (LLM-friendly JS, clean JSON output); a JMX export path could serve orgs standardized on JMeter.
Source and full README: github.com/krishanchawla/k6-loadtest-mcp ↗